

Mitragynine content varies by an order of magnitude: how to read COAs
7 September 2026

Mitragynine in dried Mitragyna speciosa leaf typically falls somewhere between 2 and 27 mg g⁻¹ (roughly 0.2% to 2.7% w/w), though some surveys report peaks closer to 4.94% w/w. Treat any single figure as a snapshot, not a constant: geography, season and the laboratory method used all shift the result.
TL;DR:
- Mitragynine content varies broadly between 0.31% and 4.94% w/w in raw leaves and between 2.76 and 20.05 mg g⁻¹ in commercial powders, influenced by harvest timing, environment, and processing.
- The units used on analysis reports are often confusing; converting all figures to mg g⁻¹ enables accurate batch comparisons regardless of the original measurement type.
- Environmental factors such as light exposure, soil chemistry, and tree maturity significantly impact mitragynine levels, while post-harvest drying methods can cause alkaloid degradation or concentration.
- Analytical methods like LC‑MS/MS and DART‑HRMS provide the most reliable mitragynine measurements, especially when the LLOQ is clearly specified and the chromatogram is available.
- Variations in mitragynine and 7‑hydroxymitragynine across batches mean research and safety assessments should rely on batch-specific lab reports rather than strain names or single measurements.
Table of Contents
- What is a normal mitragynine content range?
- Why does mitragynine content vary so much between batches?
- How is mitragynine actually measured in a lab?
- Does 7‑hydroxymitragynine content matter as much as mitragynine?
- What happens to mitragynine content once it enters the body?
- How do you read a mitragynine COA without being misled?
- What does this variability mean for research design and public health guidance?
- Kratome perspective: what consistent lab testing actually solves
- Lab-tested Maeng Da strains for research-grade consistency
- Sources
What is a normal mitragynine content range?
If you have spent any time comparing lab reports, you already know the frustration: one certificate says 8 mg g⁻¹, another says 4.94% w/w, and a third quotes “% of total alkaloids.” These are not the same scale, and mixing them up is the fastest way to misread a certificate of analysis.
Start with the plant material itself. A widely cited plant‑survey study of naturally growing kratom populations in Thailand found mitragynine content across leaf samples ranging from 7.5 to 26.6 mg g⁻¹ dry leaf weight, averaging around 16.0 mg g⁻¹. A separate seasonal and geographic study reported an even wider spread, with raw leaf values from 0.31% to 4.94% w/w, depending on when and where the leaves were picked. Convert 4.94% w/w to mg g⁻¹ and you get roughly 49.4 mg g⁻¹, which sits well above the Thai survey’s upper bound. That gap alone tells you two things: mitragynine content genuinely varies by an order of magnitude between harvests, and the units on your COA matter as much as the number itself.
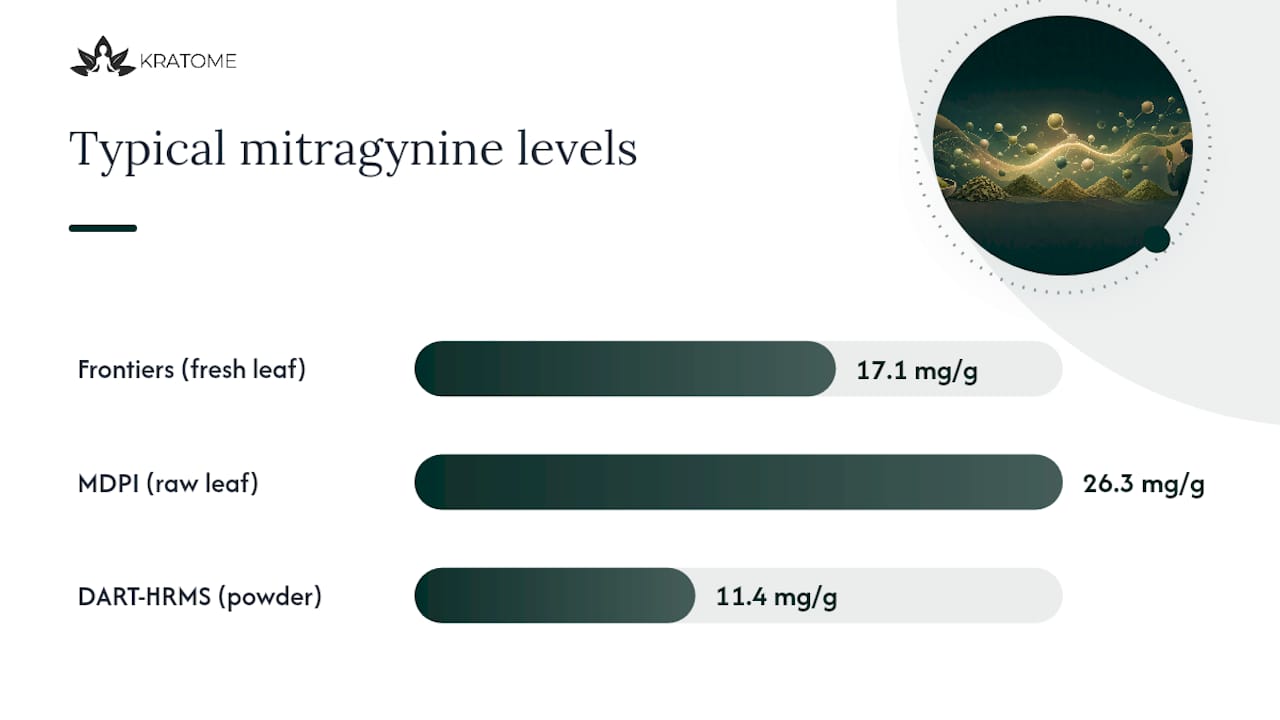
Commercial powders tell a slightly different story, because drying, blending and storage all narrow or shift the range compared with fresh leaf. A validated DART‑HRMS quantification study of commercial kratom products measured mitragynine at approximately 2.76 to 20.05 mg g⁻¹ across the products it tested, a range consistent with what the seasonal study found in finished material. That is useful context if you are trying to sanity‑check a COA: a result of 15 mg g⁻¹ on a red vein powder is unremarkable; a result of 60 mg g⁻¹ should prompt questions about the extraction method or whether the figure has been reported as “% of total alkaloids” rather than % w/w.
The distinction between those two percentage types trips up more researchers than any other unit confusion in this field. “% w/w” means mitragynine as a proportion of the total dried leaf mass, including cellulose, moisture and every other alkaloid. “% of total alkaloids” means mitragynine as a proportion only of the alkaloid fraction extracted from that leaf, which is a much smaller and more concentrated denominator. The World Health Organization’s alkaloid profile of kratom notes that mitragynine can account for up to around 66% of total alkaloids) in some samples, a figure that sounds dramatic until you realise the total alkaloid fraction itself is typically only a few percent of the leaf’s dry weight.
| Source | Material tested | Reported mitragynine range | Unit |
|---|---|---|---|
| Frontiers plant survey (Thailand) | Fresh/dried leaf, wild populations | 7.5–26.6 mg g⁻¹ (mean ~16.0) | mg g⁻¹ |
| MDPI seasonal/geographic study | Raw leaf, multiple harvests | 0.31–4.94% w/w | % w/w |
| ScienceDirect DART‑HRMS survey | Commercial powder products | 2.76–20.05 mg g⁻¹ | mg g⁻¹ |
| WHO alkaloid profile | Total alkaloid fraction | Up to ~66% of total alkaloids | % of total alkaloids |
When you are comparing two COAs, convert everything to mg g⁻¹ first. It is the least ambiguous unit, and it lets you line up a Thai wild‑population figure against a European commercial batch without guessing which denominator either lab used.
Why does mitragynine content vary so much between batches?
The short answer is that kratom behaves like most agricultural crops: it responds to its environment, its age, and how it is handled after harvest. The long answer explains why two bags of the same strain name can differ by a factor of five.
Environmental conditions do most of the heavy lifting. The Frontiers plant survey found that mitragynine accumulation correlated with light exposure, soil volumetric water content, soil pH and calcium levels, with trees grown under higher light and in particular soil chemistries producing measurably higher concentrations than shaded, poorer‑soil counterparts. The same study also found a positive correlation with girth at breast height, meaning larger, more mature trees tended to produce leaves with higher mitragynine content than younger plants. That single finding undercuts a common assumption in the kratom market: that any leaf from a mature tree is automatically higher in alkaloids. Maturity helps, but only in combination with the right light and soil conditions.
Season adds another layer. The MDPI seasonal and geographic study is explicit that harvest timing shifts the alkaloid profile substantially, which is precisely why the same named strain, sourced from the same region, can test differently in March versus October. Vein colour, the trait most buyers use to choose a strain, is really a proxy for leaf maturity and oxidation state at harvest, not a fixed chemical signature. Red, green, yellow and white vein designations correlate loosely with alkaloid balance, but they are not laboratory categories.
Post‑harvest handling is the variable most within a grower’s or vendor’s control, and also the most commonly neglected. Drying temperature, drying speed, humidity during storage and exposure to light after drying can all degrade or concentrate alkaloid content before the leaf ever reaches a lab. Slow, uncontrolled drying in humid conditions invites microbial activity and alkaloid breakdown; rapid, controlled drying preserves more of the original leaf chemistry.
For anyone collecting samples for research, a few practical habits reduce noise considerably:
- Record harvest date, region and, where possible, tree age or girth alongside every sample.
- Store dried material in sealed, opaque, moisture‑controlled conditions until testing.
- Test multiple sub‑samples from the same batch rather than relying on one aliquot.
- Note the drying method used, since temperature and duration both affect final alkaloid readings.
- Avoid pooling leaf from different harvest dates into a single “batch” before testing.
Pro Tip: If you are running a longitudinal study, retest a reference sample from the same original batch every few months. Mitragynine content in stored leaf can drift over time, and a stable reference point helps you distinguish real biological variation from storage degradation.
None of this means mitragynine content is unpredictable, only that it is genuinely a variable, not a constant. A single historic measurement of a strain tells you almost nothing about the next harvest of that same strain, which is the entire argument for batch‑by‑batch testing rather than trusting a strain name as a chemical guarantee.
How is mitragynine actually measured in a lab?
Three analytical families dominate mitragynine quantification: liquid chromatography tandem mass spectrometry (LC‑MS/MS), high‑performance liquid chromatography (HPLC), and direct analysis in real time high‑resolution mass spectrometry (DART‑HRMS), with gas chromatography mass spectrometry (GC‑MS) appearing less often because mitragynine’s thermal sensitivity complicates that method.
LC‑MS/MS is generally regarded as the gold standard for both plant material and biological samples, because it combines chromatographic separation with mass‑based detection specific enough to distinguish mitragynine from its structurally similar relatives. HPLC with UV detection is cheaper and faster but less specific, and it can struggle to separate mitragynine from co‑eluting compounds without careful method development. DART‑HRMS, the technique behind the validated commercial product survey cited earlier, offers rapid screening with high mass accuracy and has proven useful for surveying large numbers of commercial samples quickly.
Whichever method a lab uses, the limit of quantification (LLOQ) matters as much as the method name. A method that cannot reliably detect below 1 mg g⁻¹ is unsuitable for characterising a low‑alkaloid batch, and a COA that omits the LLOQ entirely gives you no way to judge whether a “not detected” result means genuinely absent or simply below the assay’s floor.
Two analytical pitfalls come up repeatedly in the literature and deserve specific attention:
- Diastereomer confusion. Mitragynine has structurally related isomers and diastereomers that can co‑elute on poorly optimised chromatography, inflating the apparent mitragynine peak if the method has not been validated to separate them.
- Matrix and extraction effects. Plant material, powder blends and biological fluids each extract differently, and a method validated on one matrix cannot be assumed accurate on another without re‑validation.
- Storage instability. Mitragynine and its analytical standards can degrade under poor storage conditions, which is one reason case‑series work on analytical and interpretative issues in mitragynine testing urges caution when comparing older reported figures against fresh testing.
- Calibration drift. Without a properly run internal standard and calibration curve on every batch, small systematic errors compound across a full run of samples.
A COA worth trusting should show its working: the analytical method by name (not just “advanced testing”), the internal standard used, a calibration curve or reference range, and the LLOQ for mitragynine specifically. Most of the meaningful validated quantification work in this field, including the DART‑HRMS survey referenced above, reports its LLOQ explicitly precisely because that number defines the boundary of what the result can actually tell you.
The number that matters most on a COA isn’t the mitragynine figure itself, but the LLOQ sitting beneath it. A result of 12 mg g⁻¹ from a method with an LLOQ of 0.5 mg g⁻¹ is a precise, trustworthy figure. The same 12 mg g⁻¹ from a method with no stated LLOQ at all is closer to a guess dressed up as data.
Does 7‑hydroxymitragynine content matter as much as mitragynine?
Not in the leaf itself, but potentially yes in the body, and that distinction is one of the most misunderstood points in kratom chemistry.
In raw leaf material, 7‑hydroxymitragynine is a minor constituent. The WHO’s alkaloid profile places it at typically under 2% of total alkaloids, a fraction dwarfed by mitragynine’s dominant share. If you were judging kratom purely by what grows on the tree, 7‑hydroxymitragynine would barely register.
The complication is metabolism. Mitragynine is broken down primarily by the liver enzyme CYP3A4, and one documented metabolic pathway converts a portion of ingested mitragynine into 7‑hydroxymitragynine after absorption. A review of kratom alkaloid metabolism and pharmacology notes that plasma 7‑hydroxymitragynine detected after dosing often reflects this in‑body conversion rather than the trace amount present in the leaf that was actually consumed. In other words, the leaf’s own 7‑hydroxymitragynine percentage tells you very little about how much of that metabolite will circulate in someone’s bloodstream after they take it.
This matters pharmacologically because 7‑hydroxymitragynine is generally considered more potent at relevant receptor targets than mitragynine on a per‑milligram basis, even though it starts out as the minority alkaloid. A leaf that is unremarkable for its 7‑hydroxymitragynine content on paper can still produce meaningful metabolite exposure once digested, which is precisely the kind of nuance a raw COA percentage cannot capture on its own.
A few practical points follow from this:
- Leaf‑level 7‑hydroxymitragynine percentage and in‑vivo 7‑hydroxymitragynine exposure are related but not interchangeable measurements.
- CYP3A4 activity varies between individuals, so metabolic conversion rates are not fixed. This has direct relevance for drug interaction risk with other CYP3A4‑metabolised substances.
- Toxicology and forensic interpretation should treat leaf alkaloid profiles and biological fluid measurements as separate questions, not one continuous number.
- Comparing potency claims across products by leaf 7‑hydroxymitragynine content alone overstates what that figure can actually predict.
Mitragynine remains the practical marker for standardising and comparing products, largely because it is present in far larger, more measurable quantities. But treating it as the only chemically relevant number, when a related comparison of mitragynine and 7‑hydroxymitragynine aimed at laboratory audiences makes clear, misses half the pharmacological picture. Mitragynine tells you what is in the bag. It does not fully tell you what happens after it is consumed.
What happens to mitragynine content once it enters the body?
Controlled human dosing studies give researchers the clearest picture available of how oral mitragynine content translates into measurable exposure, and the numbers are worth knowing before you try to predict outcomes from a product label alone.
A pharmacokinetic trial using oral encapsulated dried kratom leaf powder found a median time to peak plasma concentration (Tmax) of roughly 1.0 to 1.7 hours, with steady‑state plasma levels reached within approximately 8 to 9 days of repeated daily dosing. Half‑life estimates in that same body of work varied considerably by dose and condition, with some observations extending into the tens of hours, underscoring that elimination is not a fixed, universal number.
Steady state after roughly 8 to 9 days of repeated dosing is the single most clinically useful number in this section, because it tells researchers and clinicians how long it takes before plasma mitragynine levels stop climbing with continued regular use, a window relevant to both tolerance discussions and any interaction monitoring.
The relationship between a product’s stated mitragynine content and someone’s actual plasma exposure is not a simple straight line. Formulation affects absorption: powder in a capsule, powder dissolved in liquid, and extract concentrates all release and absorb differently even at an identical labelled mitragynine dose. Individual metabolism, largely driven by CYP3A4 activity as discussed above, further shifts how much circulating mitragynine and 7‑hydroxymitragynine a given dose produces from one person to the next.
A few grounded takeaways for anyone trying to connect a COA figure to expected exposure:
- Higher mg g⁻¹ on a COA implies a higher dose per gram consumed, but it does not tell you Cmax or AUC without knowing the individual’s absorption and metabolism.
- Forensic and clinical blood concentration ranges reported in case series span a wide spread, which analytical work on interpretative issues in mitragynine testing attributes partly to genuine physiological variance and partly to differences in analytical method and sample stability.
- Repeated dosing over roughly a week and a half should be assumed to raise baseline plasma levels toward steady state, a factor relevant to anyone monitoring safety in a research or clinical setting.
- Treat any single blood concentration figure quoted from case reports with caution unless the method validation behind it is stated, since instability and isomer resolution issues can shift reported numbers considerably between labs.
None of this is a reason to distrust mitragynine content figures on a COA. It is a reason to treat that figure as one input among several, rather than a direct predictor of what happens in a specific person’s bloodstream.
How do you read a mitragynine COA without being misled?
A certificate of analysis is only as useful as the details it discloses beyond the headline number. What tells you whether to trust it is everything surrounding that figure.
Every reliable COA should state its analytical method by name, such as LC‑MS/MS or a validated DART‑HRMS protocol, rather than a vague reference to “laboratory testing.” It should list the LLOQ for mitragynine specifically, since that number defines the smallest concentration the method can reliably distinguish from noise. It should show or reference a calibration curve and confirm use of an internal standard, both of which guard against systematic drift across a testing run. And it should specify the unit used, mg g⁻¹, % w/w, or % of total alkaloids, because as covered earlier, those three are not interchangeable.
Red flags worth watching for include COAs that report a single mitragynine figure with no method name attached, results with implausibly high concentrations relative to the ranges established in the peer‑reviewed surveys above, and any certificate that cannot produce an archived chromatogram on request. A lab confident in its own data has no reason to withhold the underlying trace.
A short, practical checklist for evaluating any mitragynine COA:
- Confirm the analytical method named (LC‑MS/MS, HPLC or validated DART‑HRMS), not just “third‑party tested.”
- Check that the LLOQ for mitragynine is stated explicitly.
- Identify the unit used and convert to mg g⁻¹ if comparing across sources.
- Look for evidence of an internal standard and calibration reference.
- Ask whether the result reflects a single sample or a batch‑replicate average.
- Request the underlying chromatogram if the figure seems unusually high or low against published ranges.
- Check the testing date against the harvest date, since stored material can drift from its original reading.
Pro Tip: Keep a running spreadsheet of every COA you review, converted to a single unit (mg g⁻¹ works best). Patterns that are invisible certificate‑by‑certificate, like a supplier’s results consistently running higher than every independent survey, become obvious the moment you line up ten or twenty side by side.
Kratome’s own lab reports are structured around exactly this logic: naming the method, stating the batch, and making the underlying data available rather than reducing quality to a single marketing number.
What does this variability mean for research design and public health guidance?
Every point made so far, about geography, season, drying method and analytical technique, converges on one practical conclusion: study design in this field has to account for batch‑level variability as a built‑in variable, not an inconvenience to control away after the fact.
For researchers designing a study, that means treating a single “kratom sample” claim with scepticism unless it specifies harvest region, testing method and, ideally, a batch‑specific COA. Replication across multiple independently sourced batches matters more here than in most botanical supplement research, precisely because the Frontiers survey and the MDPI seasonal study both demonstrate that a single harvest tells you little about the next one from the same region.
Safety monitoring priorities should extend beyond mitragynine alone. Because 7‑hydroxymitragynine exposure depends partly on individual CYP3A4 metabolism rather than leaf content alone, any clinical monitoring protocol needs to consider metabolite levels and potential drug interactions with other CYP3A4‑dependent substances, not just the labelled mitragynine dose.
For anyone interpreting public health statements or regulatory guidance on kratom, the variability documented across these studies is itself the central complication. A statement calibrated to a 5 mg g⁻¹ product and one calibrated to a 25 mg g⁻¹ product describe genuinely different exposure scenarios, even when both are labelled with the same strain name. That is not a reason to dismiss regulatory caution, but it is a reason to read any blanket claim about kratom’s effects or risks with the underlying concentration range firmly in mind.
Practical takeaways for anyone working in this space:
- Specify batch provenance and testing method whenever citing a mitragynine concentration in research or clinical notes.
- Treat strain names (red, green, yellow, white) as descriptive, not as standardised chemical categories.
- Monitor for 7‑hydroxymitragynine and known drug interaction risks separately from raw mitragynine dose.
- Favour replication across multiple batches over reliance on a single historic measurement.
Kratome’s broader research overview covers how these interpretive challenges play out across the wider kratom literature, for readers who want the fuller context beyond mitragynine content specifically.
Kratome perspective: what consistent lab testing actually solves
The honest answer to “how much mitragynine is in this bag” is never a single number pulled from a strain name. It is a number tied to a specific batch, tested by a specific method, with a specific LLOQ attached. That is the standard Kratome holds itself to, and it is the standard we think every buyer and researcher should demand before trusting a figure.
Every batch we sell carries independent laboratory testing, with a certificate of analysis available for the specific lot in hand, not a generic reference figure attached to a strain name. That distinction matters more than most vendors admit. As the variability data above shows, the same strain harvested six months apart can differ substantially in mitragynine content, so a COA is only meaningful when it is tied to the batch actually sitting on a shelf.
Our sourcing approach leans on mature leaves and controlled drying precisely because the agronomic research points there: larger, more mature trees correlate with higher and more stable alkaloid content, and controlled drying reduces the degradation risk that uncontrolled humidity introduces. Neither step eliminates natural variability entirely, because no grower can override geography or season. What it does is remove the avoidable sources of inconsistency, leaving batch‑to‑batch differences that reflect the plant rather than poor handling.
For researchers or clinicians who need characterised material rather than a marketing claim, that is the whole point of publishing batch‑specific data rather than a single average figure. A number without its method, its LLOQ and its batch reference is not a scientific result. It is a rounding error waiting to mislead someone.
Lab-tested Maeng Da strains for research-grade consistency
If you need mitragynine content you can actually verify rather than take on trust, that is a service some sellers fill: every strain ships with a batch‑matched COA, not a generic figure borrowed from an old test.
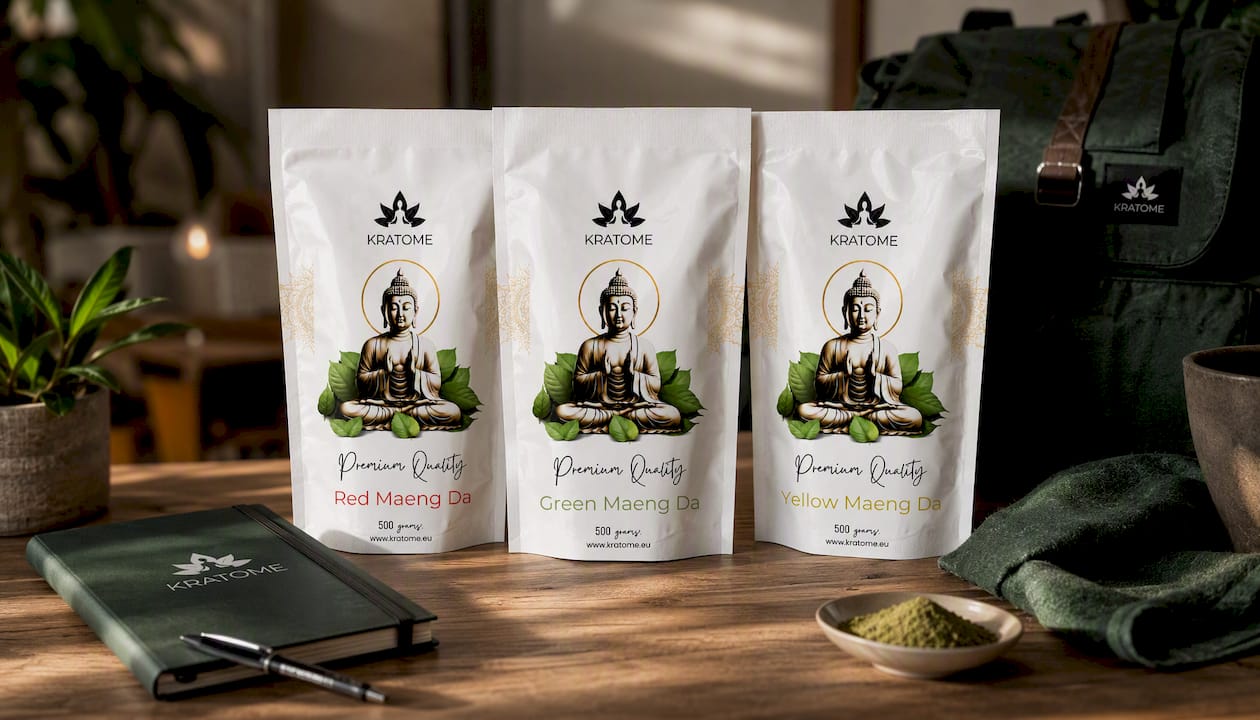
Three Maeng Da variants cover the range most researchers and clinicians ask for. Red Maeng Da is independently lab‑tested batch by batch, with its COA reflecting the specific lot shipped rather than a historic average. Green Maeng Da follows the same testing protocol, giving you a documented alkaloid profile alongside the product itself. Yellow Maeng Da completes the set, again with a batch‑specific certificate available rather than a blanket claim.
All three ship across the EU and UK, and every order includes access to that batch’s certificate of analysis, so you are working from the actual figures for the material in hand, not a number from a different harvest entirely. If you are sourcing material for characterised research use, start by checking the current lab reports for the batch you are considering, then place your order with the method and LLOQ already in front of you.
Sources
The core numeric claims in this article draw on a small set of primary sources worth reading directly if you are building on this data:
- Seasonal and geographic variation in alkaloid content of Kratom — MDPI (2023)
- Variations in mitragynine content in naturally growing Kratom populations — Frontiers (2022)
This article is general information, not a substitute for advice from a qualified doctor. Consult a qualified healthcare professional about your own circumstances before acting on anything here.
Recommended
Related reading

8 September 2026 · en
Formulation First Kratom Taper for Soapmakers With QC Checkpoints
Read article
7 September 2026 · en
Adults: 15 Minute Peppermint Relief for Headaches, Evidence and Safety
Read article
6 September 2026 · en